Designing development-to-research approaches that support positive changes in livelihoods of farmers require actions that are based on solid project evaluations and impact studies. The N2Africa project evaluations are based on the results framework and distinguish results on activities, outputs and outcomes. This framework has been used on an annual basis to monitor and evaluate progress and foster learning (Podcaster 36).
The N2Africa early impact survey report provides a comparison across eight N2Africa countries, that were involved in the first phase. The surveys were carried out DR Congo, Ghana, Kenya, Malawi, Mozambique, Nigeria, Rwanda, Zimbabwe. Results of the baseline survey (2011) and the early impact survey (2013) were both used to compare farmers' practices and to assess the impact of input packages delivered to N2Africa farmers. Each package contained legume seed (common bean, cowpea, soyabean, groundnut), mineral fertilizer and/or inoculants. The assessment consisted of a structured baseline and early impact survey among randomly sampled households. According to the design of the baseline survey, a total of 400 households per country were interviewed. All households that were interviewed for the early impact survey (300 households in each country) had participated in N2Africa dissemination trials.
We first compared the results of the baseline survey with the results of what farmers reported to cultivate four years ago in the early impact survey (before they received a N2Africa input package). Secondly, we compared results of the early impact survey before households received an input package with the results of the early impact survey: How did farmers cultivate legumes before and after they received a legume input package? These comparisons provided insights in what has changed and the impact of N2Africa activities, reported by farmers who received input packages.
Results
Changes in legume area, production and amount sold
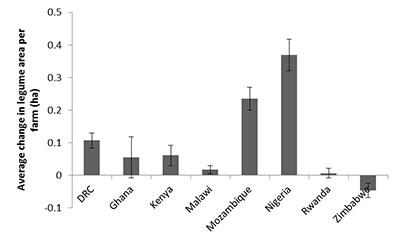
Farmers reported changes in legume area, yield and amounts sold. Overall, farmers reported an average increase in legume area per farm of 0.10 ha. Per country the average change in legume area ranged from a 0.05 ha decrease in Zimbabwe to a 0.37 ha increase in Nigeria (Figure 1). The changes reflect the results of the early impact survey before households received an input package and compare it with results of the early impact survey after households received an input package. The average amount of legumes sold increased with 124 kg farm-1. The change ranged from a 10 kg farm-1 increase in Rwanda to a 739 kg farm-1 increase in Nigeria.
| Farmers reported changes in legume area, yield and amounts sold. Overall, farmers reported an average increase in legume area per farm of 0.10 ha. Per country the average change in legume area ranged from a 0.05 ha decrease in Zimbabwe to a 0.37 ha increase in Nigeria (Figure 1). The changes reflect the results of the early impact survey before households received an input package and compare it with results of the early impact survey after households received an input package. The average amount of legumes sold increased with 124 kg farm-1. The change ranged from a 10 kg farm-1 increase in Rwanda to a 739 kg farm-1 increase in Nigeria. |
Figure 1. Average change in total legume (bean, cowpea, groundnut and soyabean) area per farm (ha) per country |
Legume cultivation
The data suggests that impact survey farmers (before they received an input package) already cultivated legumes more often than baseline farmers. This is particularly the case in DR Congo, Nigeria and Mozambique. This suggests that N2Africa targeted farmers that already cultivated legumes in these countries, to ensure the successful use of legume input packages. In the other countries the difference between the baseline survey and what impact survey farmers did before they received an input package did not differ much. The proportion of farmers cultivating legumes increased by 4% (in Malawi, Rwanda) to 26% (in Kenya). The proportion of farmers cultivating legumes after they received a legume input package varied from 91% in Nigeria to 100% in DR Congo, Rwanda and Mozambique. Whereas farmers from Zimbabwe, Malawi, Kenya and Rwanda in the baseline survey usually cultivated legumes as intercrops, farmers of the early impact survey more often cultivated legumes as monocrops.
Use of inputs in legumes
The majority of impact survey farmers (in Ghana, Nigeria, Kenya, Malawi and Zimbabwe) obtained P-containing fertilizer, mostly in the form of NPK/DAP/Compound D. In Nigeria and Kenya, farmers also obtained legume specific fertilizers, such as SSP, TSP or Sympal. Legume seed was obtained by a large proportion of farmers in Ghana, Nigeria, Kenya and Mozambique. Inoculants were obtained mostly in Nigeria and Kenya. In Ghana, Kenya, Malawi and Mozambique input use in all legumes (except for groundnut in Mozambique) increased after they received an input package.
Stratifying the results by the type of package received indicated that in all countries, except for DR Congo, the proportion of farmers that used P-fertilizer and/or inoculants increased after having received a package (as compared with farmers reported for ‘four years before’). The use of P-fertilizer on groundnut increased after having received a groundnut package in Nigeria and Malawi. The use of P-fertilizer on cowpea increased after having received a cowpea package in Nigeria and Zimbabwe. In Rwanda the use of P-fertilizer and/or inoculants in both bush and climbing bean had increased. For the other legume-country combinations the use of inputs had not increased, as compared with what farmers did before they received an input package.
Sources of inputs
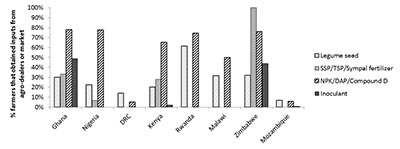
A relatively large part (50-78%) of the impact survey farmers obtained fertiliser (NPK, DAP or compound fertilizer) from agro-dealers or markets (except for DR Congo and Mozambique) (Figure 2). SSP, TSP and Sympal fertilizers, mainly used in Nigeria and Kenya, were usually obtained through NGOs or agricultural projects rather than bought on the market. Legume seed was supplied by projects and NGO’s more often than it was bought on the market. In a few cases, neighbours or relatives provided farmers with legume seed.
| Only in Rwanda more than 60% of the farmers bought legume seed from the market (Figure 2). Ghana and Zimbabwe were the only two counties where part of the farmers bought inoculants from agro-dealers or the market. In Ghana, it is possible that inoculants appeared on the ‘market’ through IFDC or from Benin. In the other counties all the inoculants were supplied by projects and NGO’s. |
Figure 2. Proportion of early impact farmers who obtained inputs from agro-dealers or the market per country |
Lessons learned and suggestions for future impact studies
Farmers interviewed in the baseline survey were a random sample with the target areas, whereas farmers interviewed for the early impact survey were intentionally selected as a sample of farmers who had participated in N2Africa. The aim was to see whether the farmers who had received a demonstration package continued to use, or expanded the use of the N2Africa technology. Consequently, farmers who participated in N2Africa had a different background in legume cultivation than the random sample surveyed in the baseline. Therefore, farmers in the baseline survey cannot serve as counterfactuals for the farmers in the early impact survey and the results cannot be extrapolated to the wider population.
Suggestions for N2Africa impact studies
The aim of the N2Africa impact studies planned for the end of the project is to assess changes in living conditions of the target group, including intended and unintended social, economic and ecological outcomes. The impact studies will also consider changes in the role of farmers’ organisations (collective marketing, farmer groups, amongst others), public-private partnerships and institutional arrangements. Furthermore, the studies will evaluate qualitatively the ‘delivery and dissemination’ strategy (D&D approach) and its learning aspects, since learning through research and dissemination activities are key to N2Africa’s approach. Household surveys, case studies and project outcome data will be used to assess specific impacts at the end of the project.
Data collected by household surveys and the standard difference-in-differences method (DiD) can be used to measure impact questions at household level. Due to the way that N2Africa has been implemented through partnerships, inevitably we have no experimental design with counterfactuals to measure the effectiveness of D&D approaches, business models and so on. In-depth case studies can be used to assess these approaches. Annually collected M&E data provide insights in changes in institutional, partners and individuals (farmers’ capacity) capacity building and the sustainability of input supply and market systems (volume of seeds, fertilizers and inoculants used, % households using inputs and volume of input types sold by agro-dealers).
Exploring sample variations at spatial (at household, regional and country level) and temporal scales offer insights in the N2Africa impact with regard to legume and rhizobia genotypes (GL x GR), environment (E) and/or management practices (M). Analysis of the N2Africa early impact survey has allowed us to explore the potential and limitations of these surveys within the constraints of project implementation. The final two years of the project will be used to design and implement a range of studies using quantitative and qualitative methods to examine the impact of N2Africa and maximise our learning.
Minke Stadler, Wageningen University, The Netherlands
References:
Ampadu-Boakye, T., van Heerwaarden, J., Giller, K. and Stadler, M. (2016). M&E and Data Management Master Plan. Report N2Africa project, www.N2Africa.org, pp 69.
Stadler, M., Van den Brand, G. and Ronner, E. (2016). N2Africa Early Impact Survey, Phase I, www.N2Africa.org, pp 61.


