In the 2017 N2Africa podcaster, I presented a section of my paper published in Field Crops Research (https://www.sciencedirect.com/science/article/pii/S037842901730727X). My 2018 update provided a brief overview of my paper on legume-maize ecological intensification options published in Experimental Agriculture (https://doi.org/10.1017/S0014479718000273). In this update, I provide a highlight from my last chapter focussed on providing an improved understanding of smallholder farming systems in the Guinea savanna of northern Ghana for targeting of grain legume intensification options.
Smallholder farming systems in the Guinea savanna of northern Ghana are characterised by poor soil fertility and other biophysical and socio-economic resources. These limitations hinder increased and sustained crop productivity needed to feed the growing population. Intensification of grain legume production is important in improving soil fertility, crop productivity, household food and income. However, a better understanding of the pattern of resources allocation, production objectives of farms and how these impact on household food availability and self-sufficiency is needed to target grain legume intensification options in contrasting sites in the Guinea savanna.
The N2Africa Ghana project’s baseline data was used for this study. The data is from survey in 2010 in seven districts, 29 villages and 400 farm households, 151 in Northern Region (NR), 129 in Upper West Region (UWR) and 120 in Upper East Region (UER). Here, I only show results for NR and UER. Food availability and self-sufficiency were estimated with per capita (adult equivalent) daily energy requirement of 2210 kcal. Energy content (kcal kg-1) used were cowpea: 3160; groundnut: 5660; soyabean: 4130; maize: 3490; millet: 3480 and sorghum: 3440. Food availability was calculated as the ratio of the total energy produced by farm household to the total energy requirement of the household multiplied by 365 days, assuming all grain produced is consumed in the household. Food self-sufficiency was estimated as the proportion of own food production consumed in the household relative to the total annual energy requirement of the household, excluding the proportion of grain sold or used for sowing. Both indicators excluded food purchased by the households as they sought to measure households’ food entitlement from own production.
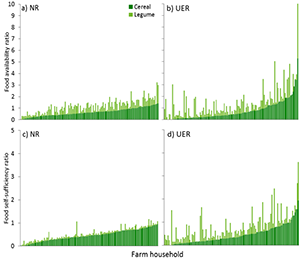
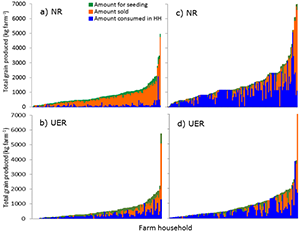
The results show that 66% of households in NR and 55% in UER are able to meet their annual food requirements assuming all grain produced is consumed in the household (Fig1a, b). However, 20% (NR) and 26% (UER) of households could only meet half or less of their required annual food needs (Fig. 1a, b). Accounting for the proportion of total grain sold or used for sowing (food self-sufficiency) led to a 43% decline in the proportion of households that could meet their annual food requirements in NR and 25% in UER (Fig. 1c, d). Alongside, the proportion of households that were only able to meet only half or less of their required annual food needs increased by 27% in NR (Fig. 1c) and 15% UER (Fig. 1d). The contribution of grain legumes to food requirements of households decreased by 26% (from 38% to 12%) in NR but by 6% (from 49% to 43%) in UER (Fig. 1a – d). These differences reflected the disparity in production objectives of farm households, with farms in NR orienting legume grain for the market and selling over 70% compared with 32% in UER (Fig. 2a, b). Is it worth noting that, farms in NR allocated 29% of the total cropped land to grain legume production compared with only 16% in UER (data not shown). Household size being 37% larger in NR also accounted for the less favourable self-sufficiency situation in NR despite total cereal and legume grain production being about 40% larger in NR (Fig. 2). Thus, production objective and resource allocation pattern of farms should be carefully considered in targeting grain legume intensification options to contrasting regions in the Guinea savanna of Ghana.
|
Fig. 1. Food availability and food self-sufficiency of farm households in (a, c) Northern region (NR) and (b, d) Upper East region (UER) of Ghana. Note the different scales for the food availability and self-sufficiency ratios, which was meant to provide better visual appraisal of the bars. |
Fig. 2. Production objectives of farm households as indicated by the proportion of total grain production of legumes (a & b) and of cereals (c & d) consumed in the household, sold for income or used for sowing in Northern (NR) and Upper East (UER) regions of Ghana. HH refers to household. |
Michael Kermah, Wageningen University & Research, The Netherlands (Click here for his 2018 update)