|
This year, N2Africa has invested in improving the flow of research data from field to data analysis. In all core countries, project staff and implementing partners received hands-on training on the use of electronic data collection forms. The new tools have been received with much enthusiasm and most data collection is now done using tablet devices. This has allowed data from the different field trials to be collected, processed and compiled much more quickly than was possible using paper forms. The advantages of using tablets extend beyond the fact that data does not need to be transferred from paper to an electronic form. The fact that the tablet-based forms come preloaded with information on locations, crops and treatments means that the data is much more uniform, removing the need for time-consuming editing of information. The built-in GPS device and camera also provide great benefits in the field. |
Field training on the use of tablets in Nigeria |
Of course, faster delivery also means that the handling of data needs to keep pace. This requires an automated system for compiling, formatting and sharing data. We have worked hard to set up such a system in Wageningen, and are currently able to automatically compile all data uploaded from the tablets into our database and to make the information available to everyone on the N2Africa Intranet.
| To showcase the power of our new data infrastructure we present some preliminary analysis of data that was uploaded during 2015. The data was processed and analysed automatically, with minimal need for specific cleaning or editing. Figure 1-2 shows results from climbing bean diagnostic trials that took place in season 2015A in Uganda. The main aim was to compare the effect of different nutrient treatments in different localities. |
Figure 1. Graph showing (square root transformed) yields for different treatments in a climbing bean diagnostic trial in Uganda |
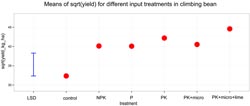
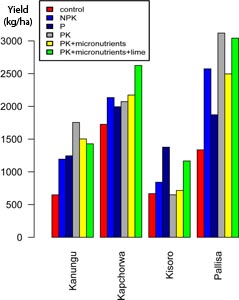
Figure 2 shows the average yields (square root transformed) for the different treatments, together with the least significant difference. It is clear that the application of phosphorus increases yield and that there is relatively little evidence for an overall response to N, K, micronutrients or lime. A breakdown per district (Figure 2) shows that yields vary strongly among locations. The variations in treatment responses observed in this figure are not statistically significant.
|
Figure 2. Graph showing mean yields for different treatments per district in the same diagnostic trial |
Figure 3. Map showing the GPS readings for a subset of the Ugandan bean diagnostic trials |
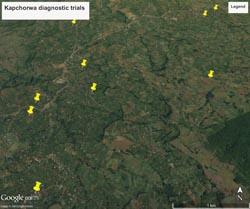
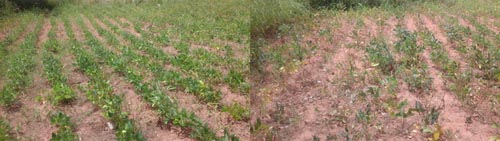
| The map in Figure 3 shows the ability to map the trial locations exactly by using the tablet’s built-in GPS. The information that this precise mapping provides can provide a very useful complement to the soil analyses that are also taking place. The usefulness of the camera is also evident from Figure 4, which shows how pictures can help in detecting problems in the field mid-season. |
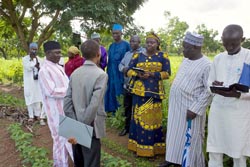
Figure 4. The N2Africa plot (left) and the farmer’s plot (right) in a Cowpea adaptation trial in Ghana photographed using the tablet |
In all, the use of tablets has been proven to be a success. We have received data from all countries, and are looking forward to receiving more soon. All uploaded data should be available for analysis within a couple of days of receipt. We are currently focused on making sure that the quality and ease of use of this data improves, and that also the data from M&E forms becomes accessible through the intranet.
Joost van Heerwaarden & Marcel Lubbers