|
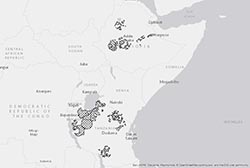
Common bean is an important crop in Ethiopia and Tanzania but the national average yield is small (respectively 0.9, and 0.8 ton ha-1; source FAO), indicating that large opportunities exists for intensification of common bean production systems. Assessment of yield potential and yield gaps could help to provide insight in opportunities to increase productivity of common bean. We investigated the water limited potential yield and the yield gap of sole crops of bush bean in the major producing areas in Ethiopia and Tanzania (Figure 1), and up scaled these results to the country level. To investigate this we used the standard protocols of the Global Yield Gap Atlas (GYGA, www.yieldgap.org). |
Figure 1. Selected common bean producing areas in Ethiopia and Tanzania for water limited yield and yield gap estimations |
Water limited yield potential is the yield with optimal crop growth (i.e. optimal soil management, no nutrient deficiencies, and no yield reductions by weeds, pests and diseases), but water can be limiting. The yield for one region is the weighted average yield of the dominant soil types, and the average of the years 1998 - 2012. The difference between the actual yield which farmers obtained and the water limited potential yield is called the yield gap. To estimate the water limited yield, a generic crop growth model, Simple Simulation Model (SSM) was used. This model uses local weather data and optimal management practices of a specific region to simulate crop potential yield. Information on optimal management practices were collected by N2Africa agronomists or derived from default values in the SSM model. Optimal management practices were for example sowing date and planting density. An optimal plant density of 50 plants m-2 was used. This value was derived from the portion of the potential yield versus plant density relationship at which simulated potential yield starts to plateau. The selected density falls within the upper range of plant densities used in field experiments aimed at maximizing yields sub-Saharan Africa. In contrast, the average planting density in Ethiopia and Tanzania were respectively 25 and 15 plants m-2. Estimation of the optimal sowing date was based on GYGA protocol. This protocol prescribes that sowing was done when the cumulative amount of rainfall is above a certain threshold value (i.e. 20 mm) within a sowing window. This window is based on information from N2Africa agronomists, and is an average period when farmers generally sow.
|
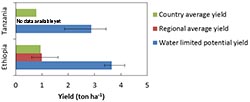
For the variety selection in the SSM model, we used generic varieties to simulate the potential yield of the local high yielding varieties. Selection of the generic variety was based on the management information provided by N2Africa agronomists. In Ethiopia, we developed a generic bean variety for the simulation, which had a growth duration that ranged from 90 – 120 days. In Tanzania, we simulated an early and late variety that were suitable for the different regions. The preliminary results of water limited potential yields of common bean in Ethiopia and Tanzania and yield gaps in Ethiopia, show large differences between the countries. In Ethiopia water limited potential yield was 3.7 ton ha-1, in contrast to Tanzania where it was around 2.9 ton ha-1 (Figure 2). This large difference can mainly be explained by the lower cumulative rainfall during the growing season in Tanzania compared to Ethiopia. Differences in water limited potential yields within the country can largely be explained by differences in growth duration. |
Figure 2. Average water limited potential yield (blue), and actual yield (red) for the selected production regions (Figure 1), and country average actual yield (green) (source FAO) of common bean in Ethiopia and Tanzania. Error bars indicate the range of yield levels among the different production regions in the country. |
|
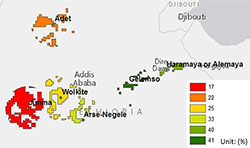
In Ethiopia, current actual yields for common bean are only 27% of potential yields. Farmers’ yields are far below the potential yield, due to suboptimal management practices such as sparse planting. Timing of sowing, nutrient application, and weed management could also be suboptimal. Furthermore, the harvest index simulated by the model for potential yield was very high (e.g. 0.6). This implies that applying appropriate management practices improves crop yield. There were large regional differences within Ethiopia (Figure 3). In Haramaya and Gelemoso, actual yields were around 40% of the potential yield, while in Jimma and Adet, the actual yields were only around 20% of the potential yields (Figure 3). In Haramaya and Gelemos the smaller yield gap was explained by the high actual yields in comparison to the potential yield. The opposite applies in Jimma where actual yields were small in comparison with the potential. By contrast, in Adet the large yield gap can be explained by the high yield potential in this region due to the long growing season. |
Figure 3. Relative yields (actual yield/water limited potential yield*100) of common bean in different regions in Ethiopia. Red indicates low relative yield, and green a high relative yield. |
Final results of common bean in Ethiopia and Tanzania will soon be available on yieldgap.org.
Nanyan Deng1 & Marloes van Loon2
1 University of Nebraska Lincoln, United States
2 Plant Production Systems, Wageningen University & Research, The Netherlands