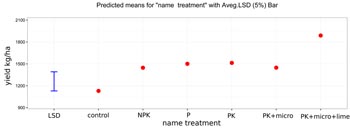
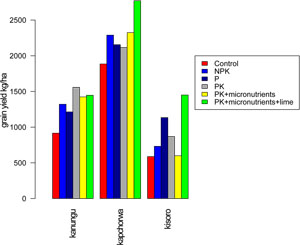
In Podcaster 34 of last year, we reported on progress on our data flows. As an example of how fast data turnover enables timely learning, we presented results of a 2015 climbing bean diagnostic trial in Uganda. Two figures showed the average effects of different inputs and the variation in those effects across different districts.
After seeing the results, the Uganda team kindly pointed out that the data used for the analysis contained an error. One of the soyabean trials from Pallisa, turned out to have been erroneously documented as a climbing bean trial. Based on this new insight we could correct the data and present the adjusted figures (Figure 1 and Figure 2).
|
Figure 1. Graph showing average yields for different treatments in a climbing bean diagnostic trial (with the 5% least significant difference shown in blue) in Uganda |
Figure 2. Graph showing mean yields for different treatments per district in the same diagnostic trial in Uganda |
The detection and removal of this minor error shows the strength of our data management system. By generating early feedback on data analysis, country teams and data analysts can quickly draw lessons from the most recent trials and can immediatly spot inconsistencies in the data. The system has now advanced further by the addition of an on-line analysis tool that offers the ability to perform exploratory statistical analysis within a day after uploading the data.
We hope that this new tool will help country teams to quickly summarise, explore and check their most recent data.
Joost van Heerwaarden


