The N2Africa project defined its Vision of Success for generating impacts that, given the magnitude of the constraints to agricultural development in the project countries, the innovative nature of this project, and the complexity of change dynamics, will take at least 5-10 years to achieve. Reaching the end of the first phase, we conducted an early impact assessment to establish progress made towards achieving the Vision of Success. The survey was carried out in each of the eight target countries amongst farmers who had received a technology packages in a season previous to when the survey was conducted and results were compared to results from the baseline survey conducted at the beginning of the project. In this manner we are able to assess current use of N2Africa technologies on farmers’ fields.
|
The Vision of Success in N2Africa, Phase 1, project reads as follows: ‘To raise average grain legumes yields by 954 kg/ha in four legumes (groundnut, cowpea, soyabean, and common bean), increase average biological nitrogen fixation (BNF) by 46 kg/ha, and increase average household income by $465, directly benefiting 225,000 households (1,800,000 individuals) in eight countries in sub-Saharan Africa’. The data on households reached is obtained from the M&E records. The number of direct beneficiaries of the project is considerably higher than the targeted 225,000 households and this does not include an additional estimated 12,000 farmers reached through satellite activities. |
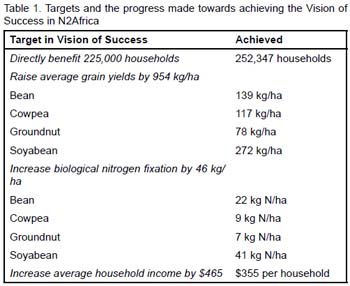 |
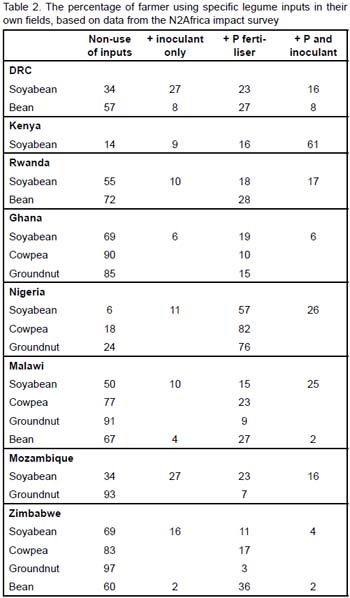
The assessment of the impact of N2Africa technologies on legume yields in Table 1 is based on responses of legumes to the application of inputs in N2Africa’s dissemination and demonstration trials and the current use of N2Africa technologies assessed in the early impact assessment. The increase in average grain yield is a weighted average amongst the different categories of adopters (e.g. in the case of soyabean: ‘no use of inputs’, ‘inoculants only’, ‘P fertilizer only’ and ‘full adoption’). Not all farmers use all components of the legume package in their own fields and a considerable percentage does not use any of the inputs (Table 2). We see marked differences between countries in the adoption of the technology. Kenya stands out with the high rates of full adoption of the soyabean technology (61%). In Nigeria we see high partial adoption rates (only 6% that do not use any inputs for soyabean). In Nigeria we also see strong adoption in the use of fertilizers for the cowpea and groundnut (82% and 76% respectively). Generally the use of inputs for beans, cowpea and groundnut are considerably less than for soyabean, with Zimbabwe and Ghana scoring relatively low. We assume the partial adoption has much to do with the availability and accessibility of the inputs, and with the perception and preferences of the farmer.
|
Fig. 1. Average yield achieved in the control treatment (‘old’ yield), average yield with the current use of N2Africa technologies (‘new’ yield), average yield achieved with complete use of N2Africa technologies, and the attainable yield as indicated by the 25% highest yielding plots in a region. Values for different crops were averaged across N2Africa countries and based on dissemination and demonstration trials in N2Africa.
For our assessment, we took an average yield and yield response observed in the dissemination and demonstration trials. This masks the fact that a wide variability in yields is recorded within areas, which is typical for multi-locational on-farm trials. Only in cases where average yield in a given area and season was exceptionally low, for instance due to drought, variability was reduced. This variability in responses greatly affected the profitability of the promoted technologies for an individual farmer. The average yield in the 25% highest yielding plots in the dissemination and demonstration trials gives an indication of the attainable yield in a region. |
 |

These attainable yields were generally much higher than the average yields with current use of N2Africa technologies, or the expected average yield with full use of N2Africa technologies (Fig. 1). Full adoption of the N2Africa package increases yield, but to close the yield gap between current average and attainable yield and to achieve the yield increases stated in the Vision of Success more than the use of N2Africa technologies alone is needed. Enhanced understanding why certain farmers achieve only poor responses to N2Africa technologies is major research goal in the N2Africa project. If causes for low yields can be effectively tackled, it may be possible to achieve or exceed the impact on yield stated in the Vision of Success on the longer term.
The estimated increase in average household income is estimated at $355, which is below the target of $465, but more than may be expected given the modest gains in yield reported. Increases in legume area and rotational effects of legumes on a subsequent crop (in our assessment assumed to be maize) had a strong impact on net benefits. The calculation of net benefits from enhanced legume cultivation is based on a partial budgeting exercise in which not all costs and benefits have been included. For instance, labour requirements have not been included, because of a lack of reliable data. We did include an estimation of monetary benefits that could have been earned from a crop (assumed to be maize) replaced by an expanding legume crop. In certain countries, e.g. in Mozambique, arable land is often not limiting and expanding the area under a legume crop does not always come at the expense of another crop (provided that the labour devoted to additional legume production does not reduce the farmer’s ability to grow other crops). In the majority of N2Africa regions however, farmers have limited access to arable land, and an expansion of legume is likely to reduce the area under another crop. Furthermore, it is well possible that training, e.g. on home processing of soybean grain, resulted in value addition and higher net benefits, but this is not accounted for in the current assessment.
Given the large number of households reached and the considerable increase in average household income, the total net benefits of the project are much higher than the originally anticipated $31.9 million.
Jeroen Huising and Linus Franke